


Out of the blue, I received one email and one LinkedIn message on data visualization opportunities that aligned with my interest AND skills. And, these opportunities were local! Both were coming from Toronto. What a combo.
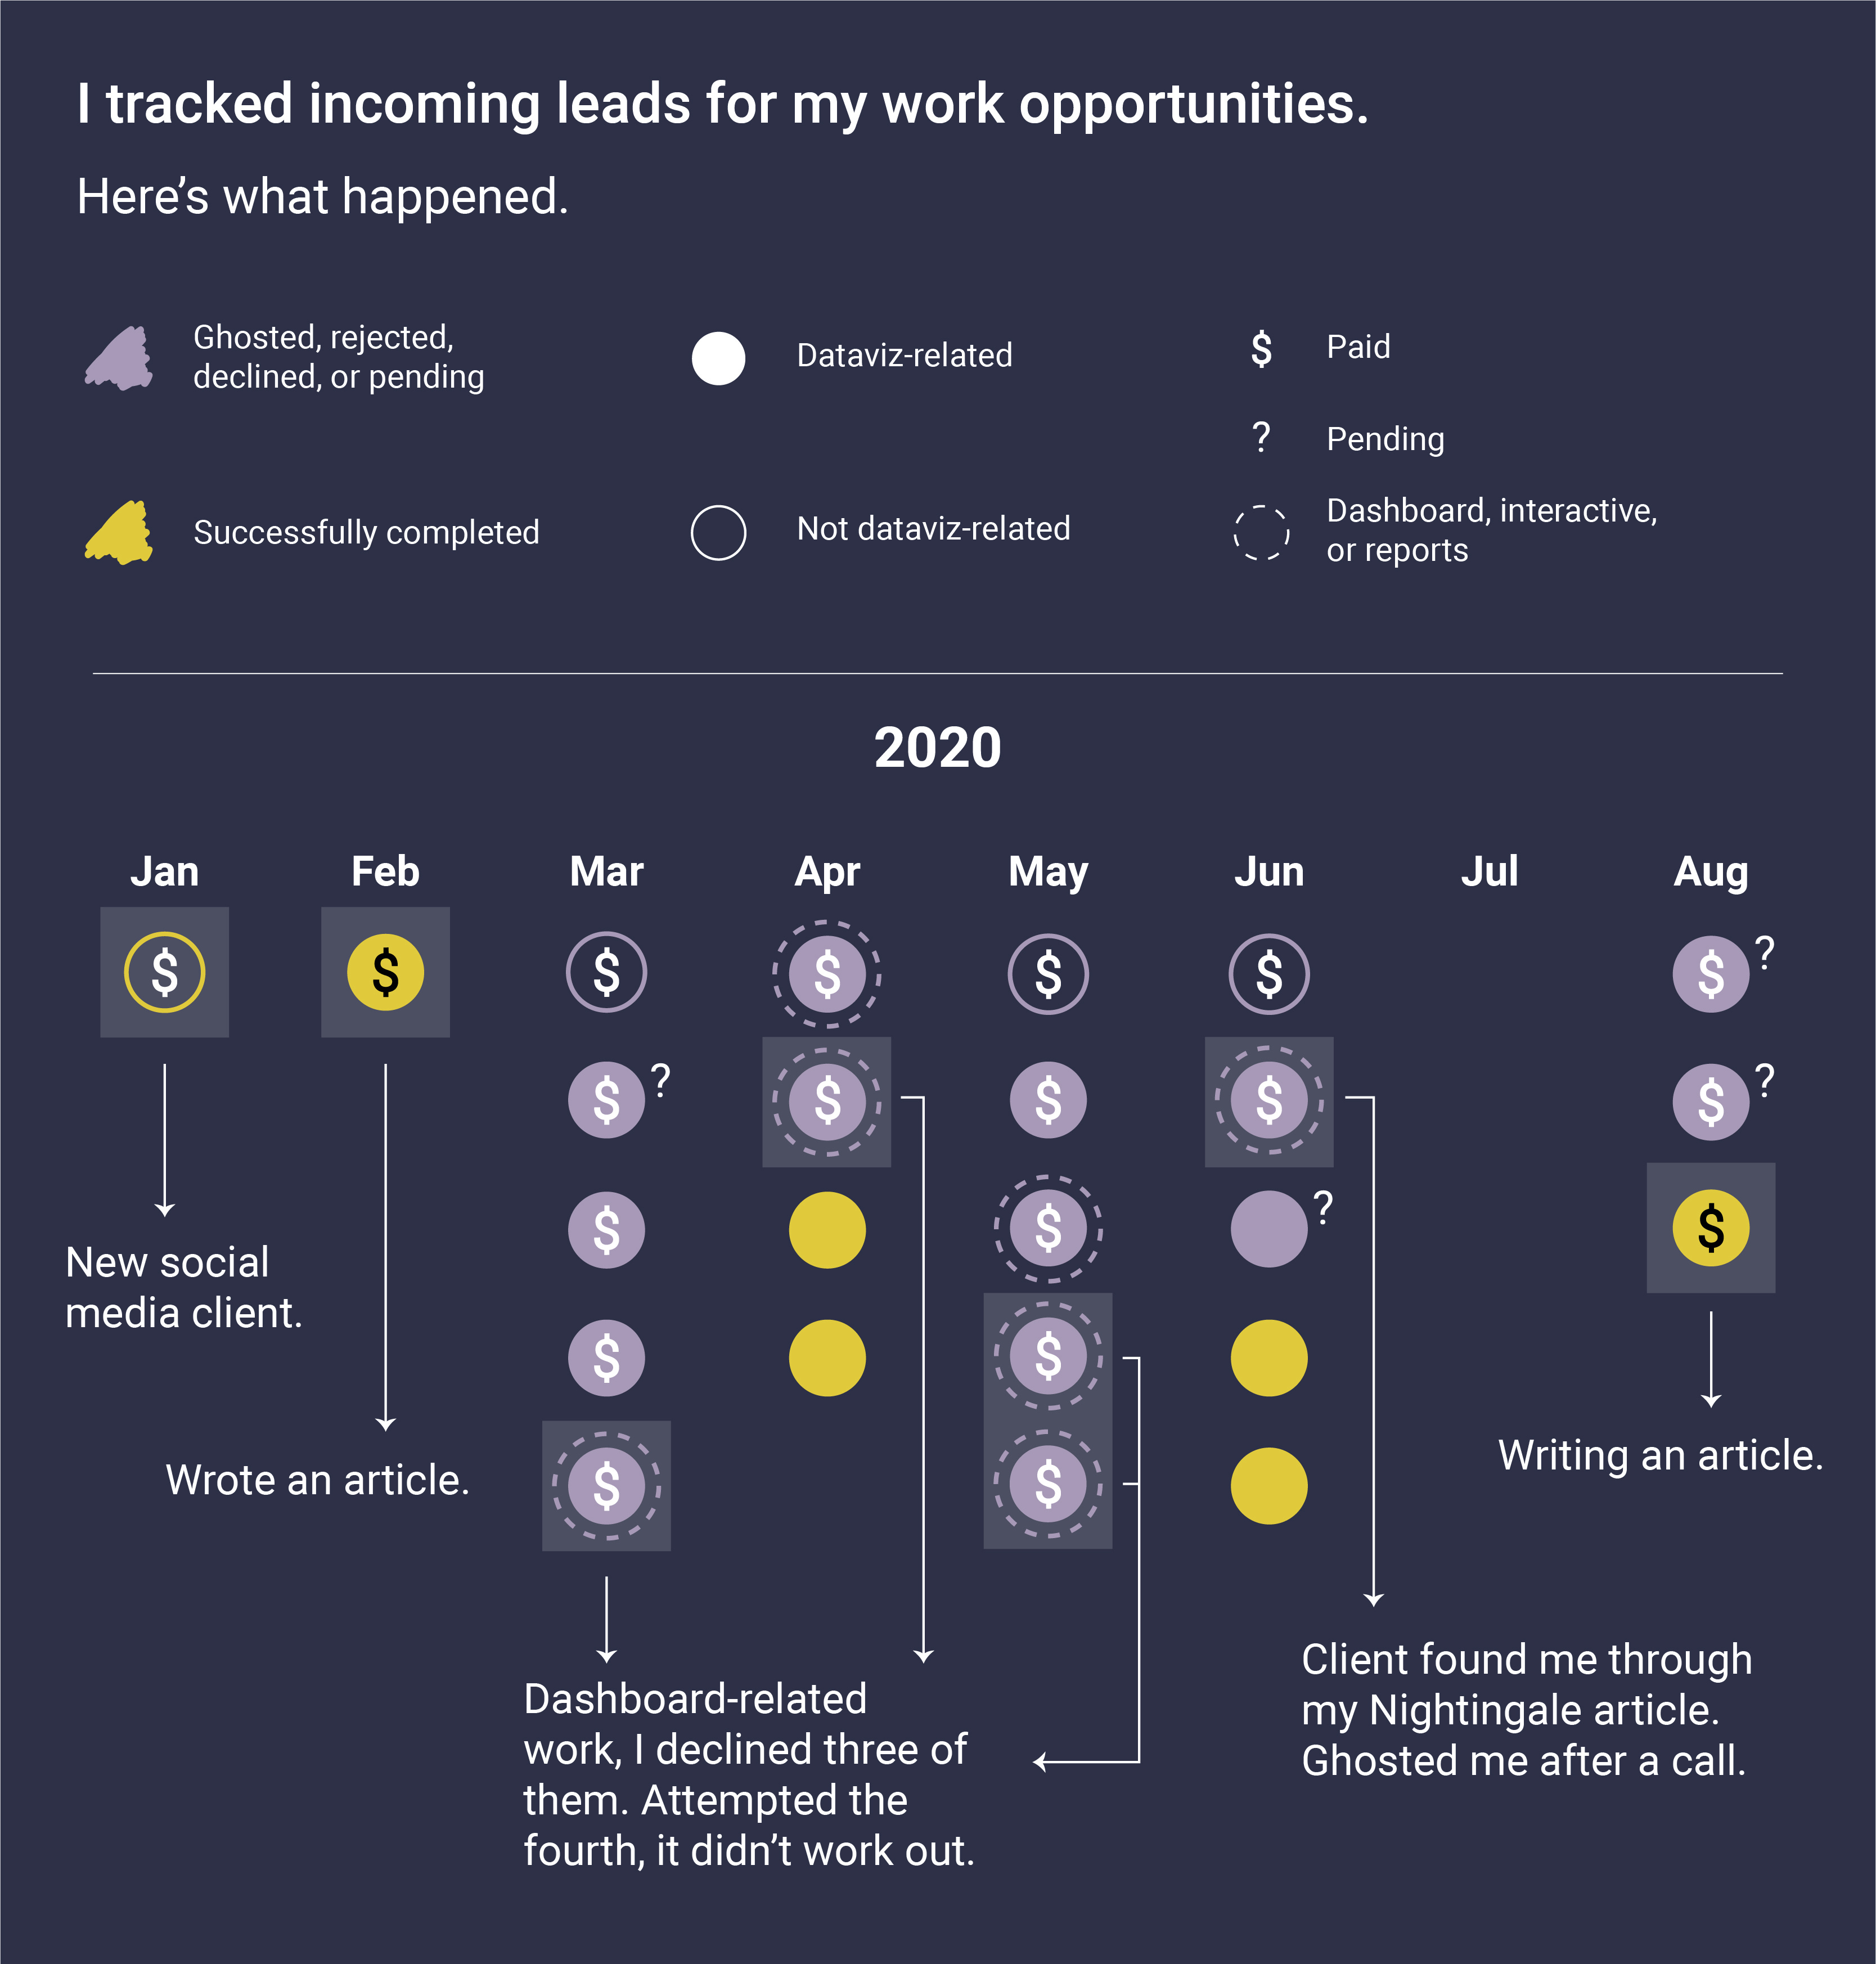
I was so tired of getting requests asking about dashboards and cracker-dry reports in the past 8 months. I designed a visualization to describe this experience. I tracked every lead I got since January. None of the dataviz opportunities worked out. The reason for this is extremely clear, my skills did not meet the demands of the market. It was obvious and June was when I seriously considered pivoting into a different industry. But, two promising opportunities came to me in August.
The first opportunity came from a big Canadian bank. They were looking to hire someone internally, they had full-time and contract positions. The second one was from my alma mater. They needed someone with a data visualization background to host a workshop. The best thing about these two opportunities were that I could bring tremendous value with my existing skills and be paid for it. I remember chuckling in disbelief because I got these two requests in the same week. I was so close to giving up, but with some patience and luck, things started coming together.
These two opportunities were great learning experiences, I’ll break each one down for you.
Big Bank
The senior manager found me through LinkedIn and has looked up my website to see my work. One of his team members reached out to me for a phone call. I honestly thought it was spam because he didn’t look like a recruiter and he didn’t update his LinkedIn details with his current employment. The first call we had was just the team member and we talked about the role. It sounded like the role was new and they didn’t have anything formal in place, such as a job posting. It seemed to be on-the-fly, this meant it wasn’t a streamlined process.
What worked:
Asking how they found me: this is so important if you are freelancing. Know what sources are helping you generate leads. Even when people connect with me, I ask how they heard about me.
Asking why they are hiring: there are so many reasons for people to hire. It could be to replace someone, perhaps there is more work coming in, or they need new skills (which was my case).
Asking why they wanted to move away from bar charts: I challenged them on this because I hate nothing more than to get an answer of “we want to make cool charts”. That’s a huge red flag for me because it means they don’t understand the real value of good data visualization. He struggled to answer my question properly, but said something along the lines of wanting to stand out. Which I get, they want to be different.
Asking them ‘why me’: this question is for them to state the value they imagine I could bring to them. They had the option to reach out to other people, why me? What is something I can do others can’t? I encourage you to ask this question when possible. We suck at advocating our strengths, and somehow give more credibility to a third-party perspective.
What could be better:
Clarifying if the position was independent or employee: in Canada, you can be hired as an independent contractor either as an employee (so they put you under their system and take care of your taxes and you might also get health benefits), or they can register you as independent (I take care of all the taxes myself, and I have the advantage of deducting taxes for certain expenses). I didn’t clarify and if I had known, I would’ve quoted a different rate. If you are Canadian, you can read more here about the differences.
Quoting a higher rate: this is painful to write, but I chickened out. I got too scared and said a rate lower than what I wanted to quote. I regretted it because on the second call, the senior manage was quick to accept my rate. I immediately knew my rate was lower than what they expected. Oh well, live and learn I guess.
It was interesting to learn why this bank wanted to hire someone like me. They had a team of UX designers and developers. They deal with a lot of data but no one on their team was a data person who understood design and how to package it for human consumption. They came to me because I breathe data visualization. I took a huge risk to specialize only in data visualization and nothing else, and it paid off. There’s barely anyone who competes with me in Toronto. The downside is that the data visualization culture matures too slowly with few independent people. If you work for organizations, your work hides behind the great confidential wall, work that doesn’t get shared doesn’t improve. As a collective, we can’t advance.
This opportunity hasn’t been finalized, it’s still in progress. Whether or not it works out, it gives me some hope that what I am doing is worthwhile.
Teaching data visualization
I was very excited to get this opportunity, especially in Toronto. The downside was that I had no control over how I was paid. I would be paid for the 3 hours of the workshop, and 2 hours for prep work (which isn’t a lot of time). I am getting paid $83.50/hr CAD, so that’s $417.5. The way to make this more worthwhile is to get more mileage out of it. I plan to record this workshop and release it online to show my expertise.
What worked:
Asking upfront about the rate in the emails before we set up a meeting: knowing this helped me gauge if it would be worth my time. If not, then no need to meet.
During the call, asking in detail about how students would apply data visualization: applications vary so widely, digital, print, interactive. It’s helpful to know this so I can cater to their needs. I am user-centric at all times.
Asking how they found me: the coordinator follows me on LinkedIn and has been seeing the stuff I regularly post. LinkedIn is THE place for opportunities. Twitter and Instagram hasn’t been as successful.
Asking who else they talked to: this is important to understand the market. How are they finding people like me?
What could be better:
Asking about a deposit payment: I forgot to ask this, but it was important to know. It’s not a good idea to start any work without anything to prove a promise on their end. In the end, they don’t do deposits. The alternative was to have a contract signed, which they provided. This was better than working off of nothing.
Once again, asking the technical details of how I’d be paid: when I got the contract, they put me as an ‘employee’. Didn’t know this was the case. It wouldn’t have changed my decision to do the workshop, but would’ve been good to know.
I wish I had the bravery to ask if the rate was negotiable. This is the rate they offered. I didn’t bother asking, but wish I had some confidence to. Maybe I could’ve asked for a higher rate. Who knows. Talking about money is so hard.
The main reason I took on this workshop was because I wanted to help Toronto advance in data visualization. Even by a little. There’s a huge focus on big data in Toronto, but not enough on design.
Moving forward
I was very lucky to have these two opportunities come to me. It was unexpected. I am jealous of people who live in places where data visualization has gained acknowledgement and respect (London, New York, San Francisco, Milan). I have always questioned if I was in the right environment to cultivate my talent and creative tastes. For family reasons, it is very difficult for me to leave Toronto to build a career elsewhere. As a result, I was determined to make something out of myself at home and work hard to build brand awareness. And here I am, seeing some fruits of my labour.
In case you missed it
I published a new article on Nightingale. I wrote about the Tekken project and how it completely changed my process. It’s a deep look at how data visualization as a medium can help teach people ‘how to think’, not ‘what to think’. This article emphasizes my process. A lot of people ask me what my process is like and this article explains it in detail.
Here is a friend link to the article. If you have a Medium Membership and would like to support me, use this link instead.

About Jane
I am an independent data visualization designer based in Toronto, Canada. To see my latest work, check out my website.
Ever since I became an independent designer in 2019, I’ve had many insights about life, work, data visualization, design, and creativity. I have been documenting these insights as much as I can through various mediums. In 2020, I decided to start a newsletter where I can put all these insights in one place. This newsletter is meant for people who want to learn more about what it’s like to be an independent data visualization designer.
Feel free to send me questions or topics you’d like me to explore by replying to this e-mail or by commenting to this post.
Read the full archive of newsletters here.


Share this post